Platform / Capability
Real-time OEE and TEEP, ranked in dollars.
KaizenFlow turns Overall Equipment Effectiveness and TEEP into a live signal, not a monthly spreadsheet. It reads the data your plant already produces, decomposes every lost minute and rejected part into the Six Big Losses, and ranks each one by the dollars it is costing you right now.
Live OEE and TEEP, every line and cell
KaizenFlow computes OEE and TEEP continuously, for every line, cell, and asset you connect. The score updates as the shift runs, so the number your operators see at 2pm is the number your plant leaders discuss at the standup, not a figure someone rebuilds by hand three days later.
You can read effectiveness at any altitude: a single filler, a packaging line, a whole value stream, or the site rolled up. Every view is normalized for shift calendar, planned downtime, and product mix, so a slow-cycle product does not quietly punish a line that is running exactly as designed.
Computed from the systems you already run
There is no operator tablet to tap and no downtime log to keep. KaizenFlow derives the three OEE factors from signals your equipment already emits, pulled through the same connectors the rest of the platform uses: OPC-UA, MQTT, Modbus, and native links to SAP, Siemens, Rockwell, OSIsoft PI, Ignition, and Kepware.
- Availability from run and stop state, changeover events, and planned-time calendars.
- Performance from cycle counts measured against each asset's ideal or nameplate rate.
- Quality from good-count, reject, and scrap signals, tied back to the process that caused them.
Where a signal is missing or noisy, KaizenFlow flags the gap rather than guessing, so the number stays honest. If you want the underlying math first, the OEE and TEEP guide walks through the formulas and a worked example.
Availability, Performance, Quality, decomposed to the loss
A headline OEE number tells you there is loss; it does not tell you where. KaizenFlow decomposes every score into Availability, Performance, and Quality, then attributes each lost minute and rejected part to one of the Six Big Losses.
- Breakdowns and setup or changeover time, which pull down Availability.
- Idling, minor stops, and reduced speed, which pull down Performance.
- Process defects and startup rejects, which pull down Quality.
The result is a defect-to-cause trail, not a single percentage. When quality slips on a line, you see the specific reject stream and the process window it came from, so the fix goes to the right cell instead of the whole department.
Every loss ranked as a dollar opportunity
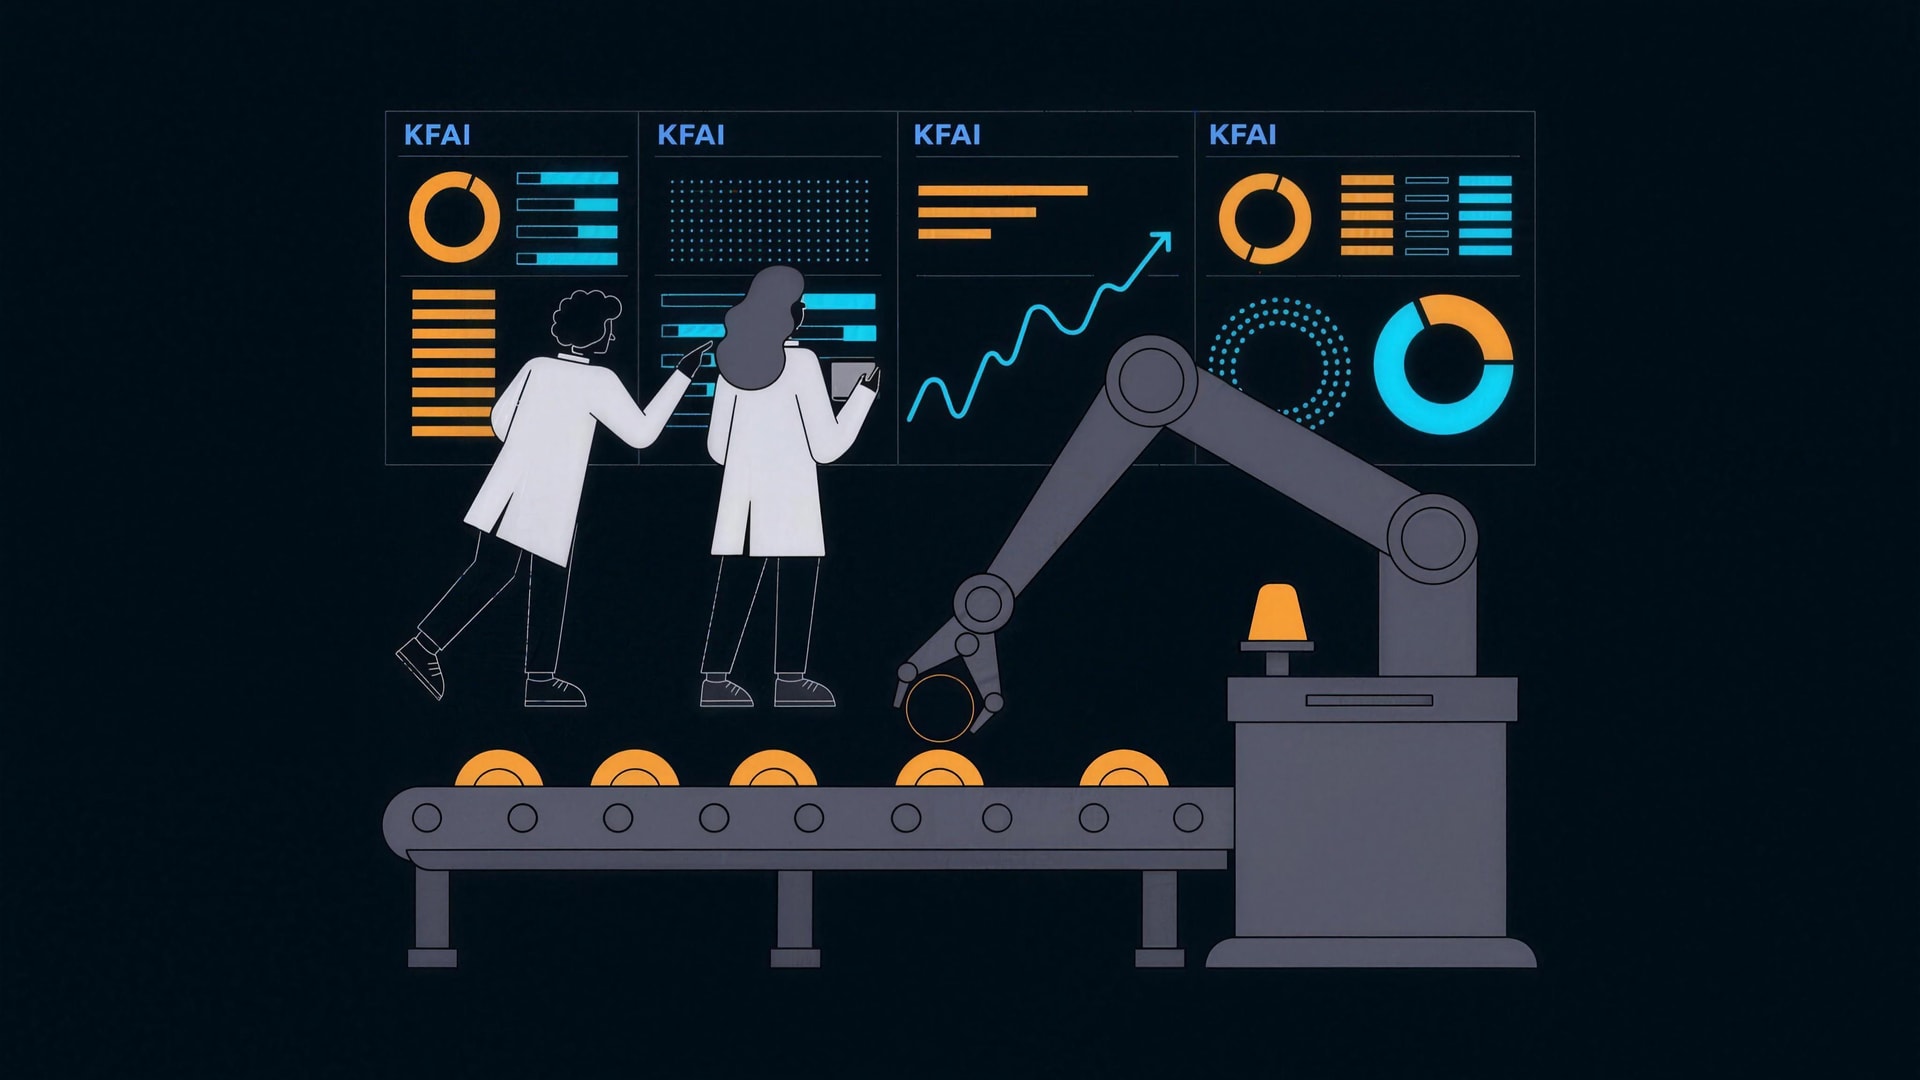
Every loss carries a cost, and that cost is what decides what to fix first. The KaizenFlow AI ensemble attaches a dollar value and a confidence score to each loss stream: the Throughput Analyst weighs recoverable output, the Yield Modeler prices the scrap and rework, and the Reliability Forecaster estimates the downtime a recurring failure will keep taking.
The output is a ranked backlog, sorted by dollar impact rather than by whoever shouted loudest. Two lines can share the same 71% OEE while one hides a six-figure changeover problem and the other a rounding error. The ranking makes that difference obvious before you spend an engineer's week on the wrong one.
Across the design-partner program, the losses this surfaces map to modeled target ranges of 8 to 18% lower unplanned downtime, 4 to 11% higher throughput, and 5 to 12% less scrap. These are modeled ranges, not achieved results, and every figure is meant to be proven against your own baseline.
TEEP for capacity and capex decisions
OEE asks how well you ran when you were scheduled to run. TEEP asks how much of your total capacity you are using at all. KaizenFlow computes both, adding the Utilization factor that compares planned production time to every hour on the calendar.
That distinction changes capital decisions. A line with strong OEE and weak TEEP is idle capacity you already own, and TEEP puts a number on it before anyone signs a purchase order for a line you may not need. Operations improves against OEE; planning and finance read TEEP.
From metric to verified savings
Ranking a loss is a claim. KaizenFlow closes the gap between the claim and the result. Once an action is taken, before-and-after effectiveness is measured against a normalized baseline and reconciled into a verified savings ledger your finance team signs, so an OEE gain becomes a traced dollar figure rather than a projection on a slide.
This capability is one lens on the wider platform. See how the closed loop connects, surfaces, decides, and verifies on the platform overview, where the same signals also feed downtime, quality, and energy work.
Your data stays isolated per tenant, encrypted with TLS 1.3 in transit and AES-256 at rest, on a platform aligned to SOC 2 and ISO 27001 controls.
Frequently asked
Do we need to install sensors or operator terminals to get OEE? In most cases no. KaizenFlow computes OEE from run state, cycle counts, and reject signals your MES, SCADA, or historian already records. It fills gaps with connectors rather than new hardware, and flags any equipment where a required signal is genuinely missing.
How is this different from the OEE and TEEP guide in Resources? The guide is educational: it explains the formulas, benchmarks, and the Six Big Losses. This page is the product capability: how KaizenFlow computes those metrics live from your systems and turns each loss into a ranked, dollar-weighted opportunity.
How does KaizenFlow decide which loss to fix first? It weights each loss stream by estimated dollar impact and a confidence score, then ranks them into a backlog. A small loss on a constraint asset can outrank a large loss on a line with spare capacity, because the ranking follows the money, not the raw percentage.
Can operations, engineering, and finance all use the same OEE number? Yes. The same normalized figure drives the shop-floor view, the engineering root-cause trail, and the finance savings ledger. Each team reads it in the terms they act on, which keeps the standup and the budget review working from one source of truth.
Can it see micro-stops - the short jams operators never log? Yes, within the resolution of your source signals. Because availability comes from machine state data rather than operator logging, stops show at the granularity your PLC, SCADA, or historian records - typically seconds, not the three-to-five-minute floor manual systems have. Nothing depends on someone remembering to write a stop down.
See it on your line
Put your real OEE on the screen.
Book a walkthrough and we will model live OEE and TEEP against a slice of your own plant data, then show the ranked, dollar-weighted losses behind the number.