8-18% Unplanned Downtime
Target range modeled from design-partner baselines - not yet independently audited
OPERATIONAL INTELLIGENCE
Connect your factory data, surface improvement opportunities, and verify every dollar of savings in a ledger your finance team signs.
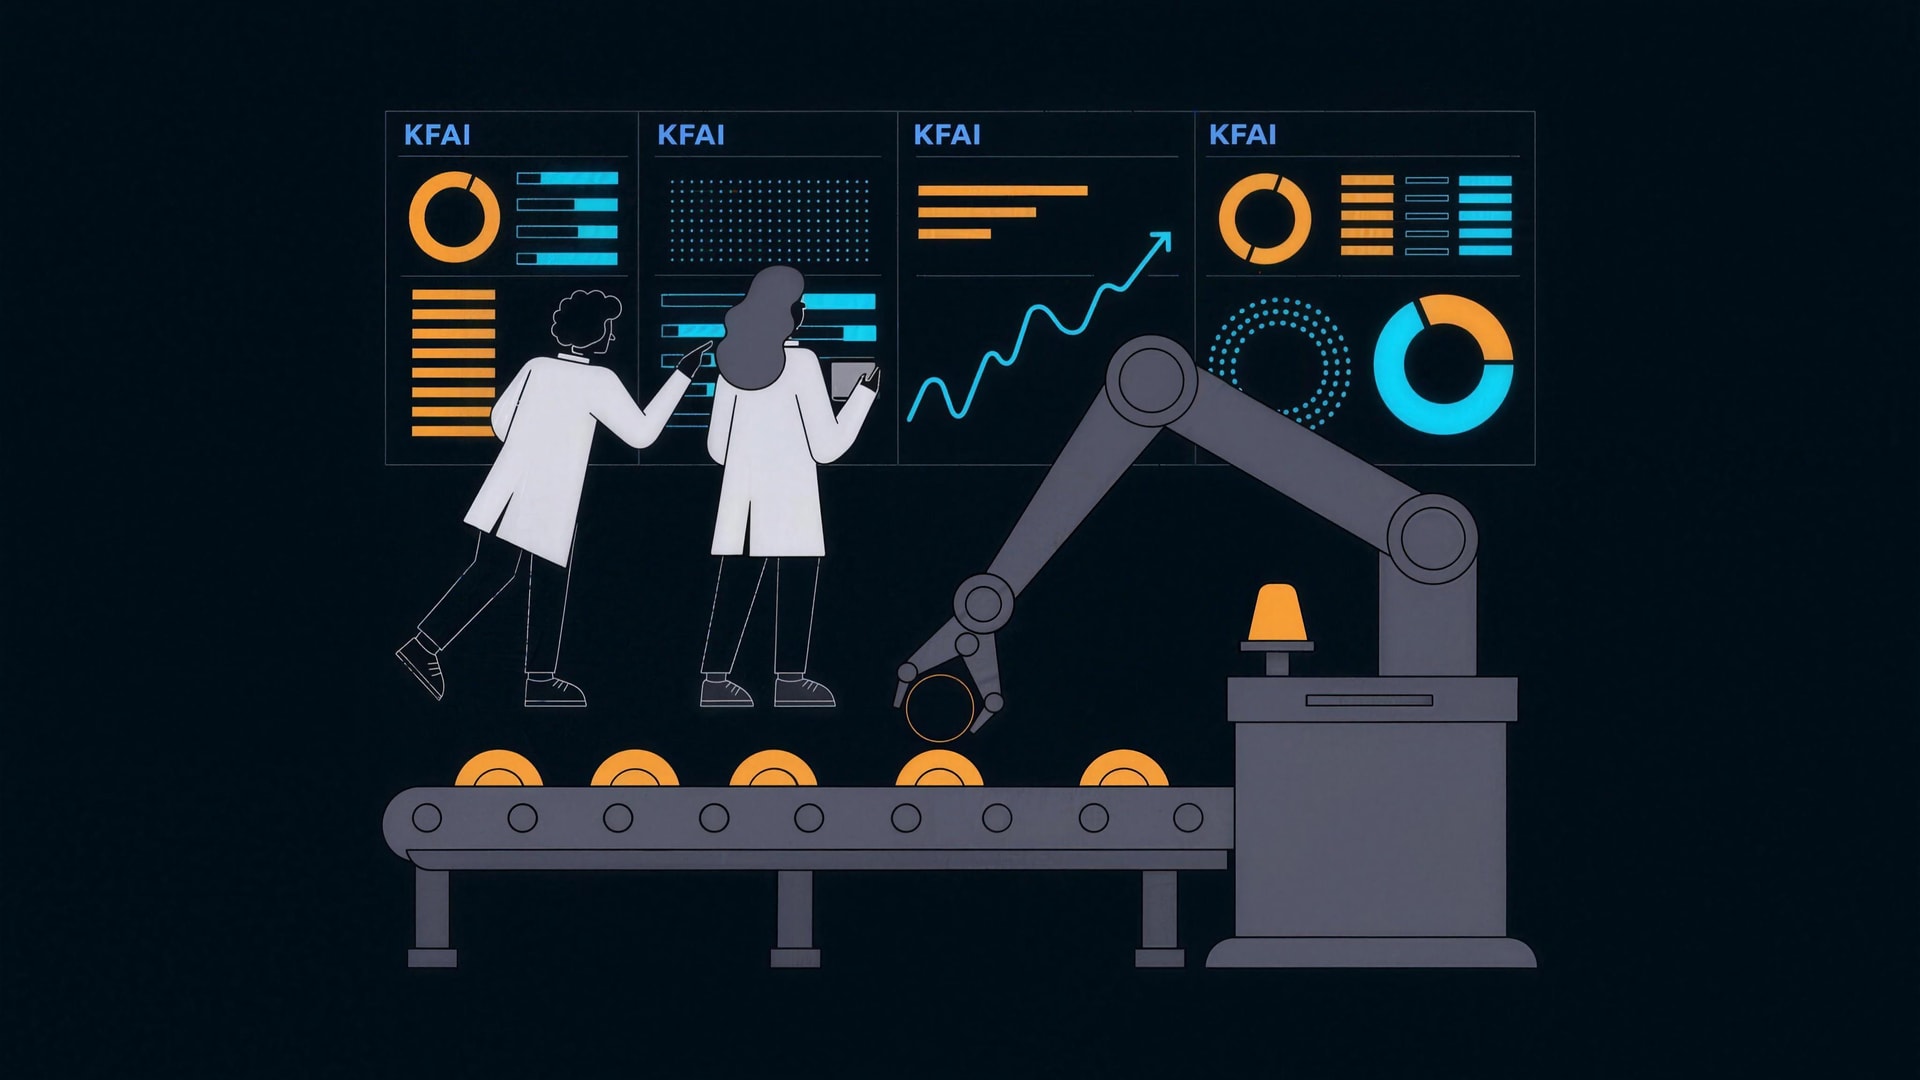
Operational and financial impact modeled with a repeatable, auditable methodology - so every stakeholder can trust what changed and why.
8-18%
Unplanned Downtime
5-12%
Scrap Reduction
10-14d
Time to First Win
Target range modeled from design-partner baselines - not yet independently audited
Illustrative line-level before/after, normalized for product mix
Modeled time from connector activation to first closed-loop savings event
Target range modeled from design-partner baselines - not yet independently audited
Illustrative line-level before/after, normalized for product mix
Modeled from shift-calendar and planned-maintenance normalization
Modeled time from connector activation to first closed-loop savings event
Figures are illustrative model outputs from our design-partner program - not audited results or live telemetry. Every pilot ships a verified before/after report reconciled with your finance team.
Live plant data arrives pending. It clears to a verified, finance-signed figure - the difference between a recommendation and a result. Illustrative close-out.
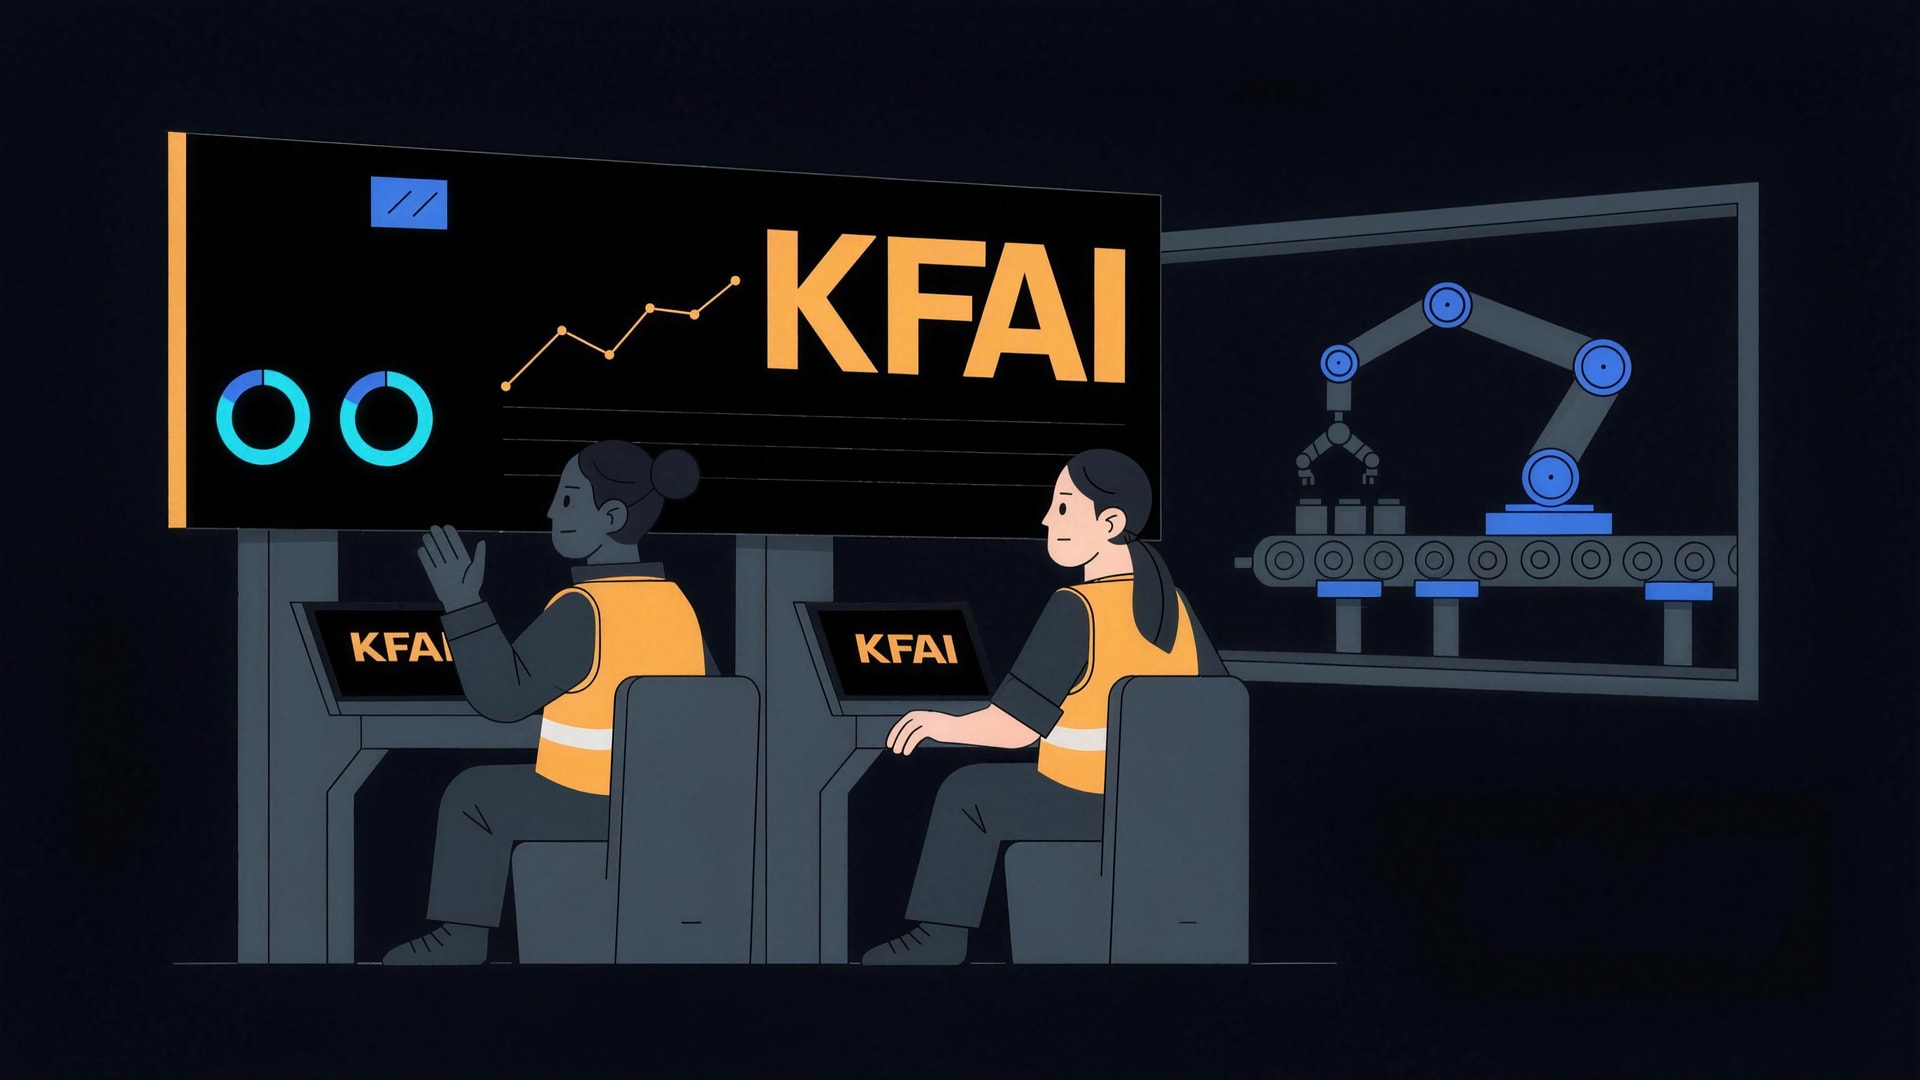
From data connection to a closed-loop verified savings report - without replacing anything you already run.
We sit on top of your current MES, SCADA, ERP, and historian stack. 43+ pre-built connectors - most plants are streaming inside an afternoon.
A purpose-built ensemble of AI specialists analyzes every signal around the clock - surfacing anomalies, predicting failures, ranking opportunities by dollar impact and confidence.
Assigned actions, owners, deadlines. Before/after measurement reconciled against estimates. Finance gets a verified savings ledger - not a slide deck.
From raw stock to final inspection - five stations, and for each one what the agent saw, the recommended fix, and the dollar impact. One illustrative line; the same loop runs on any process you connect.
Action needed
CNC milling · titanium brackets
What the agent saw
Spindle vibration up +18% over 96h. Bore diameter trending 12 µm toward the upper tolerance limit; tool wear up 6%.
Recommendation
Replace the end-mill insert set within 7 days. Predicted tolerance breach in 11-14 days at current wear rate; saves ~620 parts/day from scrap.
Estimated impact$84K/yr
Healthy
Vacuum stress-relief · hardening
What the agent saw
Case-hardness uniformity tightened from ±4.5% to ±2.1% after the revised ramp recipe. Rockwell consistency up across the last 12 batches.
Recommendation
Roll the new ramp profile to furnaces HT-02 and HT-05 - projected rework reduction on each line.
Estimated impact$142K/yr
Healthy
Ultrasonic wash · transfer conveyor
What the agent saw
Throughput steady at 1,420 parts/h vs nameplate 1,500. Bottleneck is downstream at the CMM queue (inspection backlog ↑).
Recommendation
Add a 2nd CMM fixture on 1st shift. Frees 80 parts/h of wash-line capacity = ~$9.6K/wk margin recovery.
Estimated impact$38K/yr
Watch
Robotic press-fit & fastening
What the agent saw
Fixture changeover takes 14 min on Mon/Wed shifts vs 6 min on others. Fastening-torque variance correlates with operator T-08.
Recommendation
Trigger micro-training: changeover SOP video + buddy-pair with a senior operator for 2 shifts. Expected reject rate -40%.
Estimated impact$26K/yr
Healthy
Coordinate measuring + vision
What the agent saw
Defect-detection model precision at 98.4% across part families. Drift detector predicts retraining needed in ~21 days as a new part format ramps.
Recommendation
Schedule auto-retraining on the last 30d of operator-validated inspection images. Zero labelling cost; keeps GD&T pass/fail accurate through the new ramp.
Estimated impact$12K/yr
Multi-method voting - Z-score, MAD, IQR, Isolation Forest - catches quality drift before it compounds into scrap or downtime events.
Identifies bottleneck cells, calculates capacity utilization curves, and recommends sequencing changes that lift throughput without capex.
SPC limits, Cpk monitoring, defect-to-process correlation. Surfaces the upstream signals predicting tomorrow’s quality holds.
Demand-curve fingerprinting, peak shaving recommendations, idle-load detection. Cuts $/unit-output by trimming the hidden draw.
MTBF prediction by asset class, failure-mode clustering, lead-time alerts. Converts unplanned events into planned interventions.
Changeover compression via SMED-aware sequencing. Re-orders the day to minimize setup loss without breaking promised dates.
First-pass yield analytics, scrap-root attribution, rework cost rollup. Tells you which loss streams are worth the engineering hour.
Predictive intervals replace fixed schedules. Parts forecasting, technician load smoothing, and avoided-failure quantification.
Confidence-weighted before/after measurement, baseline normalization, finance reconciliation. The verified ledger CFOs sign off on.
Connectivity
We sit on top of the systems you already run. Sync your ERP, MES, SCADA, and IoT stack into one queryable plane.
Every plant. One queryable plane. 43+ connectors.
Connects natively with

Eight weeks in, every pilot lands on one screen - a finance-reconciled savings ledger, a live opportunity feed, and a run-rate you can take to the board. Not a slide deck. Here’s a representative plant.
KaizenFlow
Overview
▦Dashboard
◆AI Suggestions7
◬Anomalies2
Operate
⚙Connectors
◷Actions4
▤Savings Ledger
Dashboard
Illustrative demo · "Apex Dynamics - Plant 03" is a composite, not a customer
OEE %
82.3
2.7 pts to go · target 85
Throughput +9%
1,335units/hr
95% of target 1,400
Utilization +3.1%
78.4%
92% of target 85%
Scrap rate −12%
2.8%
80% of target 3.5%
Energy −4%
412kWh
79% of target 520
Representative pilot · figures illustrative, verified per engagement
Return Modeling
Drag the controls. Estimates use illustrative improvement ranges from our design-partner program - a starting point, not a promise.
Estimated Annual Savings - Median Range
$2.4M
Range: $1.3M to $3.4M annually
Conservative estimate · 8-18% downtime reduction · 5-12% scrap reduction · 4-11% throughput · 3-7% energy
Design-partner pilots include a verified before/after report at 8 weeks.
The questions every operations and finance team asks before a pilot.
You go live on your data in 1-2 weeks - we connect on top of your existing stack, no rip-and-replace. The full pilot runs 8 weeks and ends in a verified before/after savings report.
No. KaizenFlow sits on top of your current MES, SCADA, ERP, and historian stack via 43+ pre-built connectors.
Our model targets 8-18% reduction in unplanned downtime and 5-12% scrap reduction in the first quarter; design-partner pilots produce a verified before/after report to confirm actuals.
Data is encrypted in transit (TLS 1.3) and at rest (AES-256), with multi-tenant isolation. Enterprise plans include private deployment.
Yes - start with a single-facility pilot, prove ROI, then expand across the network.
No dedicated hire. We stand up and maintain the connections; your side is a one-hour weekly review during the pilot, plus the floor time to execute the improvements you choose. Steady-state, there is no server, historian migration, or report plumbing for your team to babysit.
None to get OEE. KaizenFlow reads run, stop, rate, and quality signals from the systems you already have - MES, SCADA, PLCs, historians - so the numbers do not depend on operators logging codes at a terminal. Operator input is optional context, never the source of truth.
Machines and process. KaizenFlow prices losses by machine, line, shift pattern, and cause - it is not a time-and-motion tool, and it does not score individual operators. If you want employee surveillance, we are the wrong vendor.
Plants that already log production somewhere - a PLC, SCADA, MES, ERP, or historian - and can grant read-only access to at least one line. Messy tags are fine; that is normal. If your floor is mostly pre-digital machines with nothing to read, a sensor-first tool like Guidewheel is the better starting point - see our honest comparison.
We do not quote a payback number - at design-partner stage we will not dress a model up as a track record. What we will do is show you the model. The ROI calculator takes four inputs: facilities, revenue per facility, unplanned downtime hours per month, and scrap rate. It then applies the modeled ranges, infers your hourly cost as revenue divided by an assumed 6,000 production hours per facility per year, and credits 35% of a recovered hour as margin. It does not subtract subscription cost, so what it prints is gross modeled savings, not payback. Put Pro pricing at $5k-15k per month against that figure yourself, and substitute your real hourly cost if 6,000 hours is wrong for your plant. Your pilot then replaces the whole model with measured numbers in eight weeks.
Engagement
Every plan includes onboarding and a dedicated success engineer. Convert after your pilot and the full pilot fee credits toward your first year - terms confirmed before kickoff.
$25k-$75k8-week engagement · scoped by lines & connectors
Measure the ROI in one facility before scaling to the network.
★ Recommended
$5k-$15kper month · from $5k for a single facility
Full platform access with advanced analytics across your operation.
Customunlimited scale
Private deployment for regulated and multi-site operations.
Design-partner pricing - these are the rates we are quoting today, and yours are locked for your agreement term. Any adjustment happens at renewal with at least 30 days' written notice. No lock-in: either party can end the agreement with 30 days' written notice, and you leave with a full export of your data.
Choose a weekday and a time that suit your team. We confirm by email within one business day - these are requests, not held calendar slots.

Connect your data. Surface opportunities. Get a verified savings report - in eight weeks.