Platform / Capability
Catch process drift before it becomes scrap
Quality Sentry is the quality specialist in the KaizenFlow ensemble. It watches every measured characteristic your plant already records, computes control limits and process capability in real time, and traces defects back to the upstream signals that caused them, so a quality hold becomes something you see coming instead of discover at final inspection.
Live SPC on every characteristic that matters
Quality Sentry is one of nine AI specialists in the KaizenFlow ensemble, and its job is narrow on purpose: keep statistical process control running on every characteristic your plant measures. It reads dimensional checks, torque values, fill weights, test results, and inline gauge data straight from the systems that already collect them, then builds and maintains control charts without an engineer rebuilding a spreadsheet each week.
The distinction that makes SPC useful is that control limits come from the process, not the drawing. They describe how a stable process actually varies, usually within plus or minus three sigma of its own mean. Specification limits describe what the customer allows. When you watch both, you can see a process shifting toward trouble long before a single part falls out of spec.
Quality Sentry applies the detection rules quality engineers already trust, including Western Electric and Nelson rules, to flag runs, trends, and points beyond the control limits. This is statistical process control software that runs continuously across the whole plant rather than one chart at a time on one bench.
Cpk monitoring that never sleeps
Capability answers a different question than control. A chart can be in control and still produce scrap if the process spread is too wide or off center. That is what capability indices measure. Cp compares the tolerance width to the process spread. Cpk adds centering, so it penalizes a process that runs stable but shifted toward one limit.
Cpk monitoring in Quality Sentry is continuous and segmented, so you can see capability per characteristic, per shift, per tool, and per material lot rather than as a single number on a monthly report. When capability starts sliding toward the floor, you hear about it while there is still time to react.
- A common benchmark is a Cpk of 1.33 for a capable process and 1.67 for safety or regulation critical features.
- Trends matter more than snapshots: a characteristic falling from 1.9 to 1.4 is a warning even though 1.4 still passes.
- Capability is compared across shifts and tools so one drifting fixture does not hide inside a healthy plant average.
From defect back to the process that caused it
Knowing a characteristic drifted is only half the answer. The question operators actually ask is why. Quality Sentry correlates defect and scrap events with the upstream process variables recorded around them: temperature, pressure, cycle time, spindle load, ambient humidity, material lot, and the specific asset that ran the part.
Because the ensemble ranks every finding by dollar impact and confidence, defect-to-process correlation does not hand you a wall of charts. It points at the few upstream variables most likely to be driving a defect family and shows the evidence behind the ranking, so an engineer can confirm it on the floor instead of starting the investigation from zero.
Signals that predict tomorrow's quality hold
Most quality escapes are visible in the data before they are visible on a part. Variation widens, a subgroup mean creeps, a second mode appears in a distribution. These are leading signals, and they are exactly what a person scanning a busy shift cannot catch by eye.
Quality Sentry surfaces these upstream signals and connects them to the characteristics they tend to precede, so tomorrow's quality hold shows up today as a ranked opportunity rather than a surprise at final inspection. We stay honest about what this is: a prediction with a confidence attached, not a guarantee. The point is to give the engineer a head start and a reason to act.
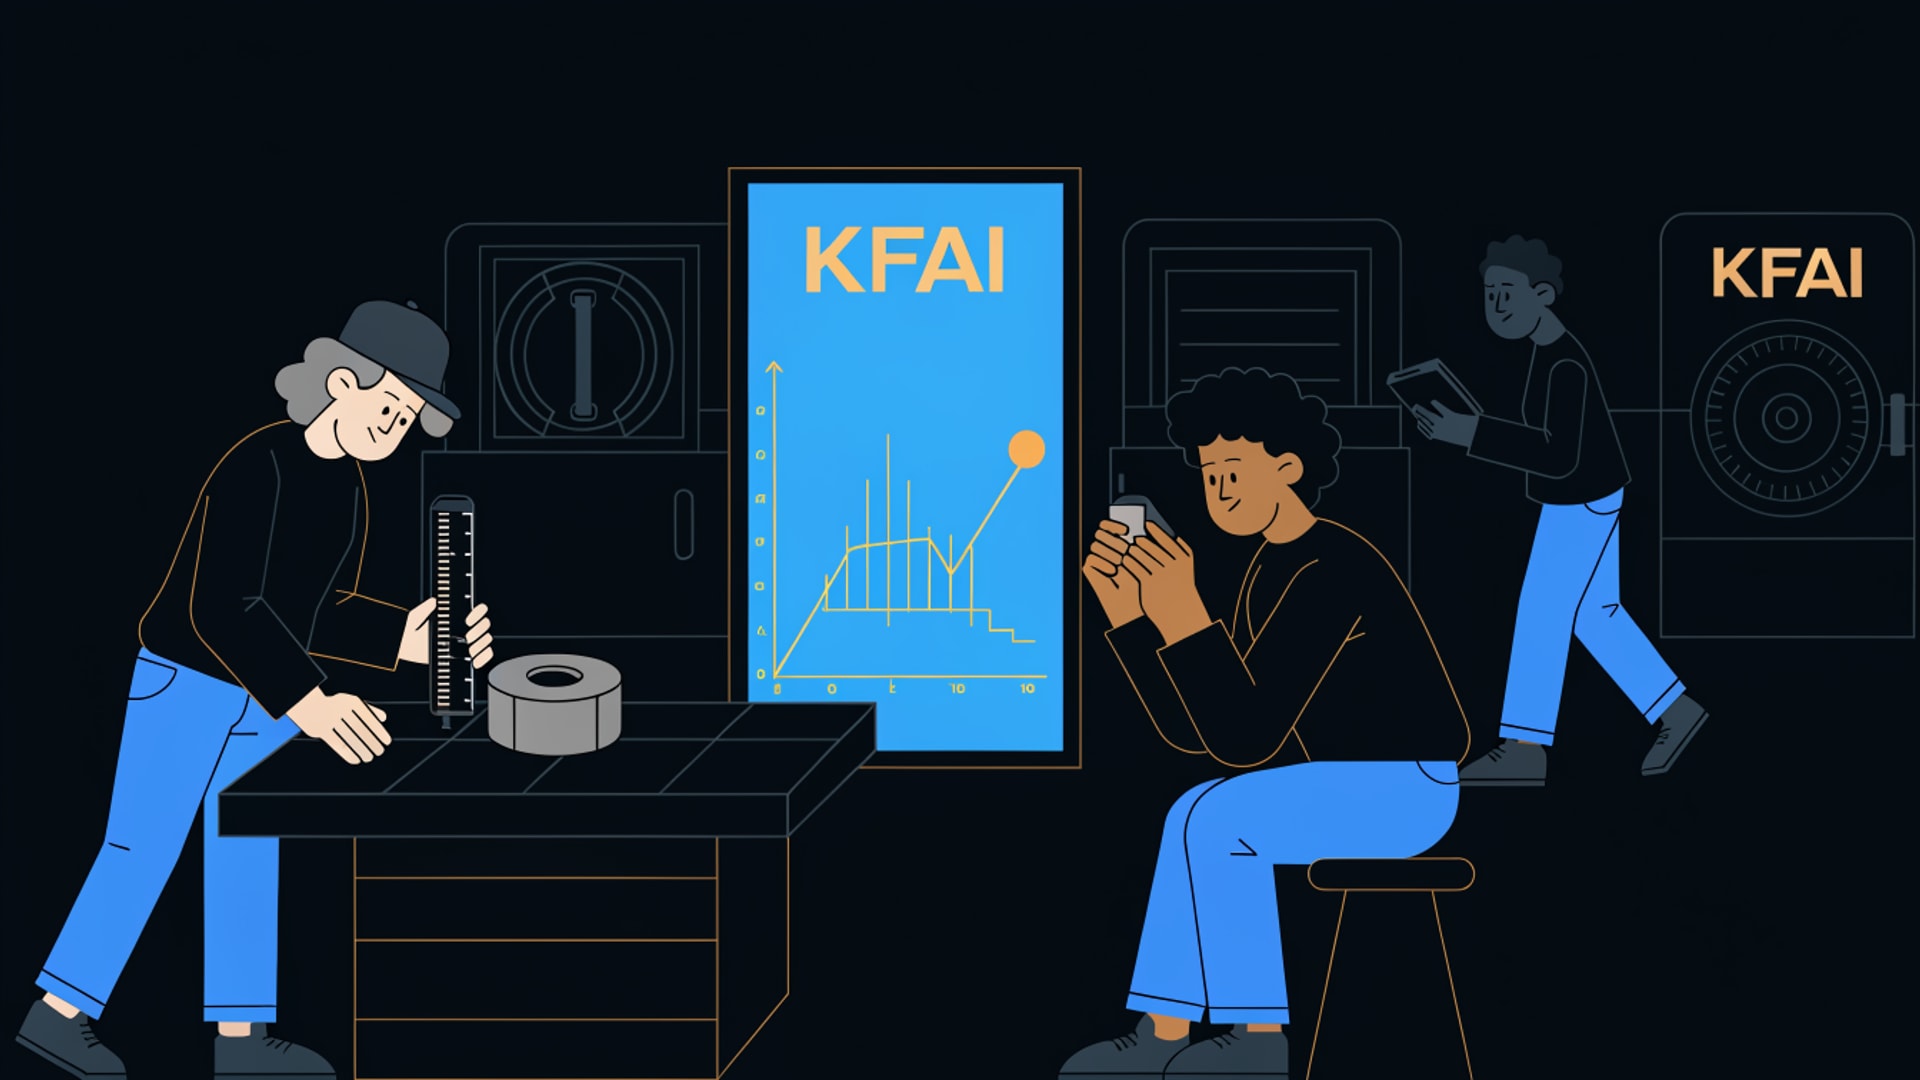
First-pass yield as a plant-wide signal
First-pass yield ties quality back to money and throughput. It is the share of units that clear every step correctly the first time, with no rework and no scrap. On a multi-step line, rolled throughput yield multiplies the yield of each step, which is why a handful of small losses compound into a number that surprises people.
Quality Sentry treats first-pass yield as a plant-wide signal, not a station statistic. When it links a yield loss to a specific upstream cause, that becomes a scrap reduction opportunity the ensemble can size. Across the design-partner program we model scrap reduction in a target range of 5 to 12 percent; treat that as an illustrative range to pressure-test against your own baseline, not a promised result. If you want the background on how yield, availability, and performance combine, our OEE and TEEP guide walks through the math.
One loop: connect, surface, decide, verify
Quality never lives alone. A quality hold can trace to a maintenance issue, a schedule change, or an energy excursion, which is why Quality Sentry works inside one loop with the rest of the ensemble: connect, surface, decide, verify. It reads from the MES, SCADA, ERP, and historian systems you already run through more than forty connectors, so there is no rip and replace.
When a quality improvement is implemented, the result is reconciled into a savings ledger that your finance team signs, the same standard applied to every specialist on the KaizenFlow platform. Data is encrypted with TLS 1.3 in transit and AES-256 at rest, tenants are isolated, and our controls are aligned to SOC 2 and ISO 27001. To see it against your own lines, talk to our team.
Frequently asked
What is the difference between control limits and specification limits? Control limits describe how the process actually behaves, computed from its own variation and usually set at plus or minus three sigma. Specification limits describe what the customer or drawing allows. SPC watches control limits so you see a process shift before a part violates spec.
What Cpk value should I monitor against? A common industry benchmark is a Cpk of 1.33 for a capable process and 1.67 for safety or regulation critical characteristics. Quality Sentry tracks the trend, not just the number, and flags a characteristic whose capability is sliding toward the floor.
Does KaizenFlow replace my MES or quality system? No. It connects on top of the systems you already run and reads their data through connectors. Your MES, SCADA, historian, and quality systems stay in place.
How is first-pass yield calculated? First-pass yield is the share of units that pass every step without rework or scrap the first time through. Across a multi-step line, rolled throughput yield multiplies the yields of each step, which is why small losses compound into a larger total loss.
See it on your lines
Put your quality data to work
Bring KaizenFlow onto the data you already collect and see where quality is drifting before it reaches your customer. No rip and replace, and every result is reconciled with your finance team.