Solutions / By role
Analytics That Frees Engineers to Engineer
Engineering and continuous-improvement teams do their best work at the whiteboard, not in a spreadsheet. KaizenFlow handles the extract, clean, and join steps across your plant's systems, runs a first-pass analysis with nine AI specialists, and hands your engineers ranked, evidence-backed leads to act on.
The bottleneck is data wrangling, not analysis
Ask most continuous-improvement engineers where their week goes and the answer is rarely analysis. It is pulling tags from the historian, exporting a shift report from the MES, matching it against an ERP work order, and reconciling timestamps that never quite line up. The thinking is the easy part. Getting clean, joined data to think about is the grind.
KaizenFlow connects on top of the systems your plant already runs. It reads from MES, SCADA, ERP, and historians through 43+ connectors, including SAP, Siemens, Rockwell, OSIsoft PI, Ignition, Kepware, OPC-UA, MQTT, and Modbus. This is manufacturing engineering analytics built to sit on top of what you already run, not another data island your engineers have to feed.
The practical effect is that your engineers stop being the integration layer. See how the platform connects, so the day starts with a question worth answering instead of an export to clean.
Nine specialists as your analyst bench
Think of the ensemble as a bench of nine analysts who never lose the thread. Each one owns a domain, watches the relevant streams, and surfaces what it finds with the evidence attached and a dollar figure on it.
- Anomaly Sentry: watches for drift and excursions across process signals before they show up as scrap.
- Throughput Analyst: isolates the constraints and micro-stops that quietly cap line output.
- Quality Sentry: tracks capability against spec and flags special-cause variation as it emerges.
- Energy Optimizer: finds load patterns and idle draw that add cost without adding output.
- Reliability Forecaster: models failure behavior per asset class and warns ahead of wear-out.
- Schedule Strategist: exposes sequencing and changeover losses in the production plan.
- Yield Modeler: links process parameters to first-pass yield so you can tune the inputs that matter.
- Maintenance Planner: turns condition and history into the right work at the right interval.
- Savings Auditor: reconciles claimed impact against measured result for the ledger.
They do the tedious first pass so a human engineer starts from a ranked short list instead of a blank query window. For a refresher on the output metrics several of these specialists track, see our OEE and TEEP guide.
The methods your team already trusts
KaizenFlow does not ask you to trust a black box. The models underneath are the methods your CI team already applies on the shop floor, run continuously instead of once a quarter.
- Anomaly detection: Z-score for well-behaved signals, median absolute deviation (MAD) when outliers would skew the mean, IQR for skewed distributions, and Isolation Forest for high-dimensional multivariate drift.
- Process capability: live SPC control charts that separate common-cause from special-cause variation, with Cpk and Ppk tracked against your spec limits. A Cpk of 1.33 is a widely used capability target, and the chart shows where you stand against it.
- Reliability: Weibull fits whose shape parameter tells you whether you are seeing infant mortality, random failure, or wear-out.
- Changeover: SMED analysis that separates internal from external setup steps to expose the time you can actually take out.
Every finding shows the method, the window, and the data behind it, so an engineer can check the work in minutes rather than take a score on faith.
From ranked signal to root cause
Detection is only useful if it points somewhere. KaizenFlow ranks every opportunity on two axes at once: modeled dollar impact and statistical confidence. A high-confidence, low-dollar blip and a low-confidence, high-dollar swing are not the same call, and the ranking makes that explicit instead of burying it in a flat alert list.
From a ranked lead, an engineer can trace contributing tags, correlated events, and the shifts or assets where the pattern concentrates. That is the difference between line 3 scrap is up and line 3 scrap tracks a specific extruder temperature excursion during warm restarts. The first is a symptom. The second is a root cause you can act on today.
This is the closed loop the platform runs on: connect, surface, decide, verify. Engineering owns the decide step, where judgment belongs, and the machine handles the parts that are just labor.
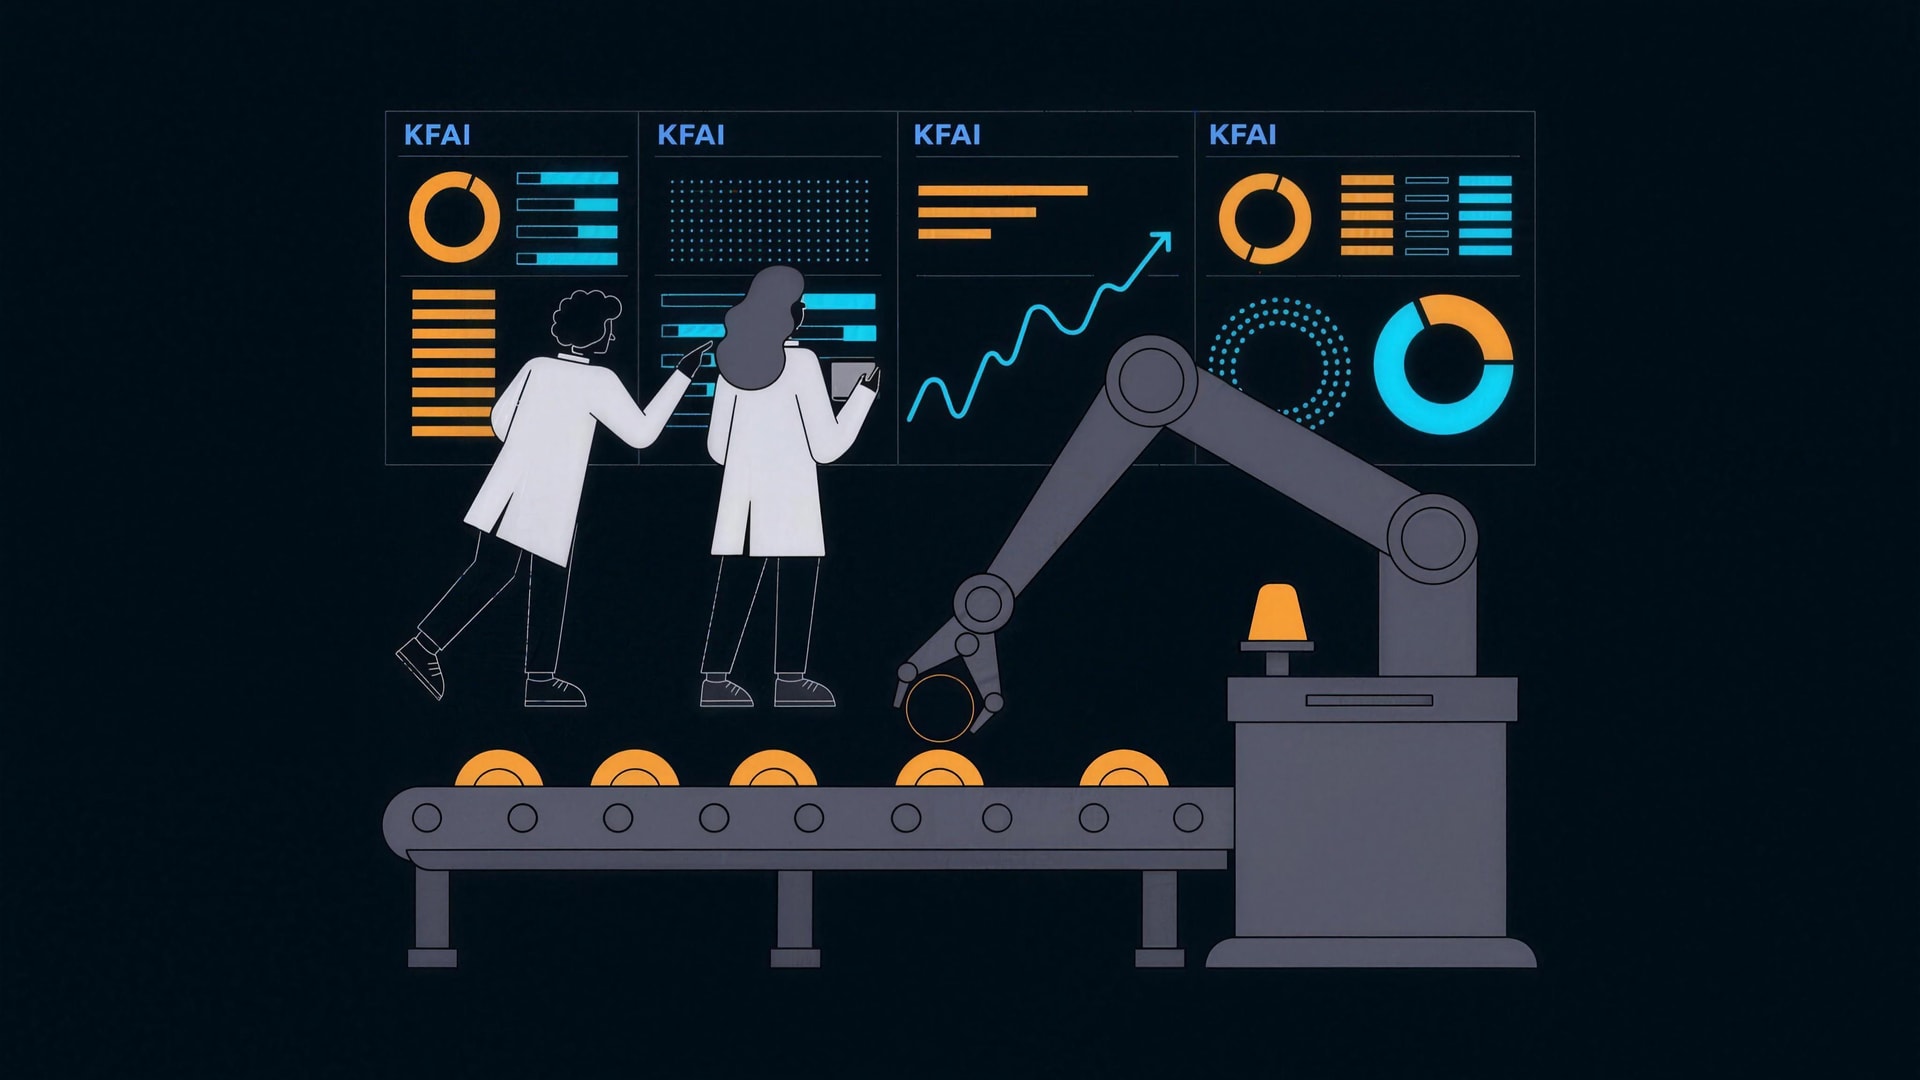
Reliability engineering without spreadsheet sprawl
For reliability engineers, the recurring pain is that the data needed to model a failure mode lives in three systems and a maintenance log. The Reliability Forecaster and Maintenance Planner assemble that history for you and fit it continuously, rather than leaving it for a manual pull each cycle.
Instead of rebuilding a Weibull analysis by hand every quarter, you get living estimates of MTBF, failure-mode distribution, and remaining useful life per asset class, updated as new events arrive. When a shape parameter crosses from random into wear-out, the bench flags it before the failure, not in the postmortem.
This is reliability engineering software that behaves like a colleague who keeps the model current, not a report you commission and wait for.
Every fix lands in a verified savings ledger
A CI team's credibility rests on whether the savings it claims hold up. As continuous improvement software, KaizenFlow reconciles every acted-on opportunity into a verified savings ledger that your finance team signs. Modeled impact sits at the top of the funnel, measured result at the bottom, and the gap between them stays visible.
Design-partner modeling points to target ranges of 8 to 18% lower unplanned downtime, 5 to 12% less scrap, 4 to 11% higher throughput, and 3 to 7% lower energy use. These are modeled ranges from the design-partner program, not guaranteed outcomes, and the ledger is where finance and engineering agree on a single number that replaces the model.
For engineering, the payoff is plain: less time defending numbers in a review, more time on the next problem.
Frequently asked
Does KaizenFlow replace our MES, historian, or SPC tools? No. It connects on top of them. KaizenFlow reads from MES, SCADA, ERP, and historians through 43+ connectors and adds an analysis layer above your systems of record, which stay exactly where they are.
What anomaly-detection methods does it use? Standard, checkable ones: Z-score, median absolute deviation, and IQR for univariate signals, plus Isolation Forest for high-dimensional multivariate cases. Every finding shows the method and the underlying data so your engineers can verify it.
Can it support reliability work like Weibull and MTBF analysis? Yes. The Reliability Forecaster fits Weibull models continuously and tracks MTBF, failure-mode distribution, and remaining useful life per asset class, updating as new events arrive instead of waiting for a quarterly rebuild.
Are the improvement percentages real customer results? No. They are modeled target ranges from our design-partner program, shown for illustration only. The verified savings ledger is where your finance team confirms your own actual numbers.
How is our data protected? Data is encrypted with TLS 1.3 in transit and AES-256 at rest, with multi-tenant isolation. Our practices are aligned to SOC 2 and ISO 27001, and product analytics uses Plausible, which is cookieless and sets no personal-data cookies.
Own your output
Put nine specialists on your engineering bench
See how KaizenFlow connects to your plant's systems and hands your CI team ranked, evidence-backed leads. No rip-and-replace, no data-wrangling tax.